
Beyond differential expression: How gene networks reveal real biology
Public repositories already hold the answers to many biological questions. The challenge is turning expression data into biology. This article explains how co-expression networks built across many independent studies reveal how genes work together, and how they turn a long list of differentially expressed genes into a few biological programs you can interpret.
By Camila Guerrero De Blois, PhD ·
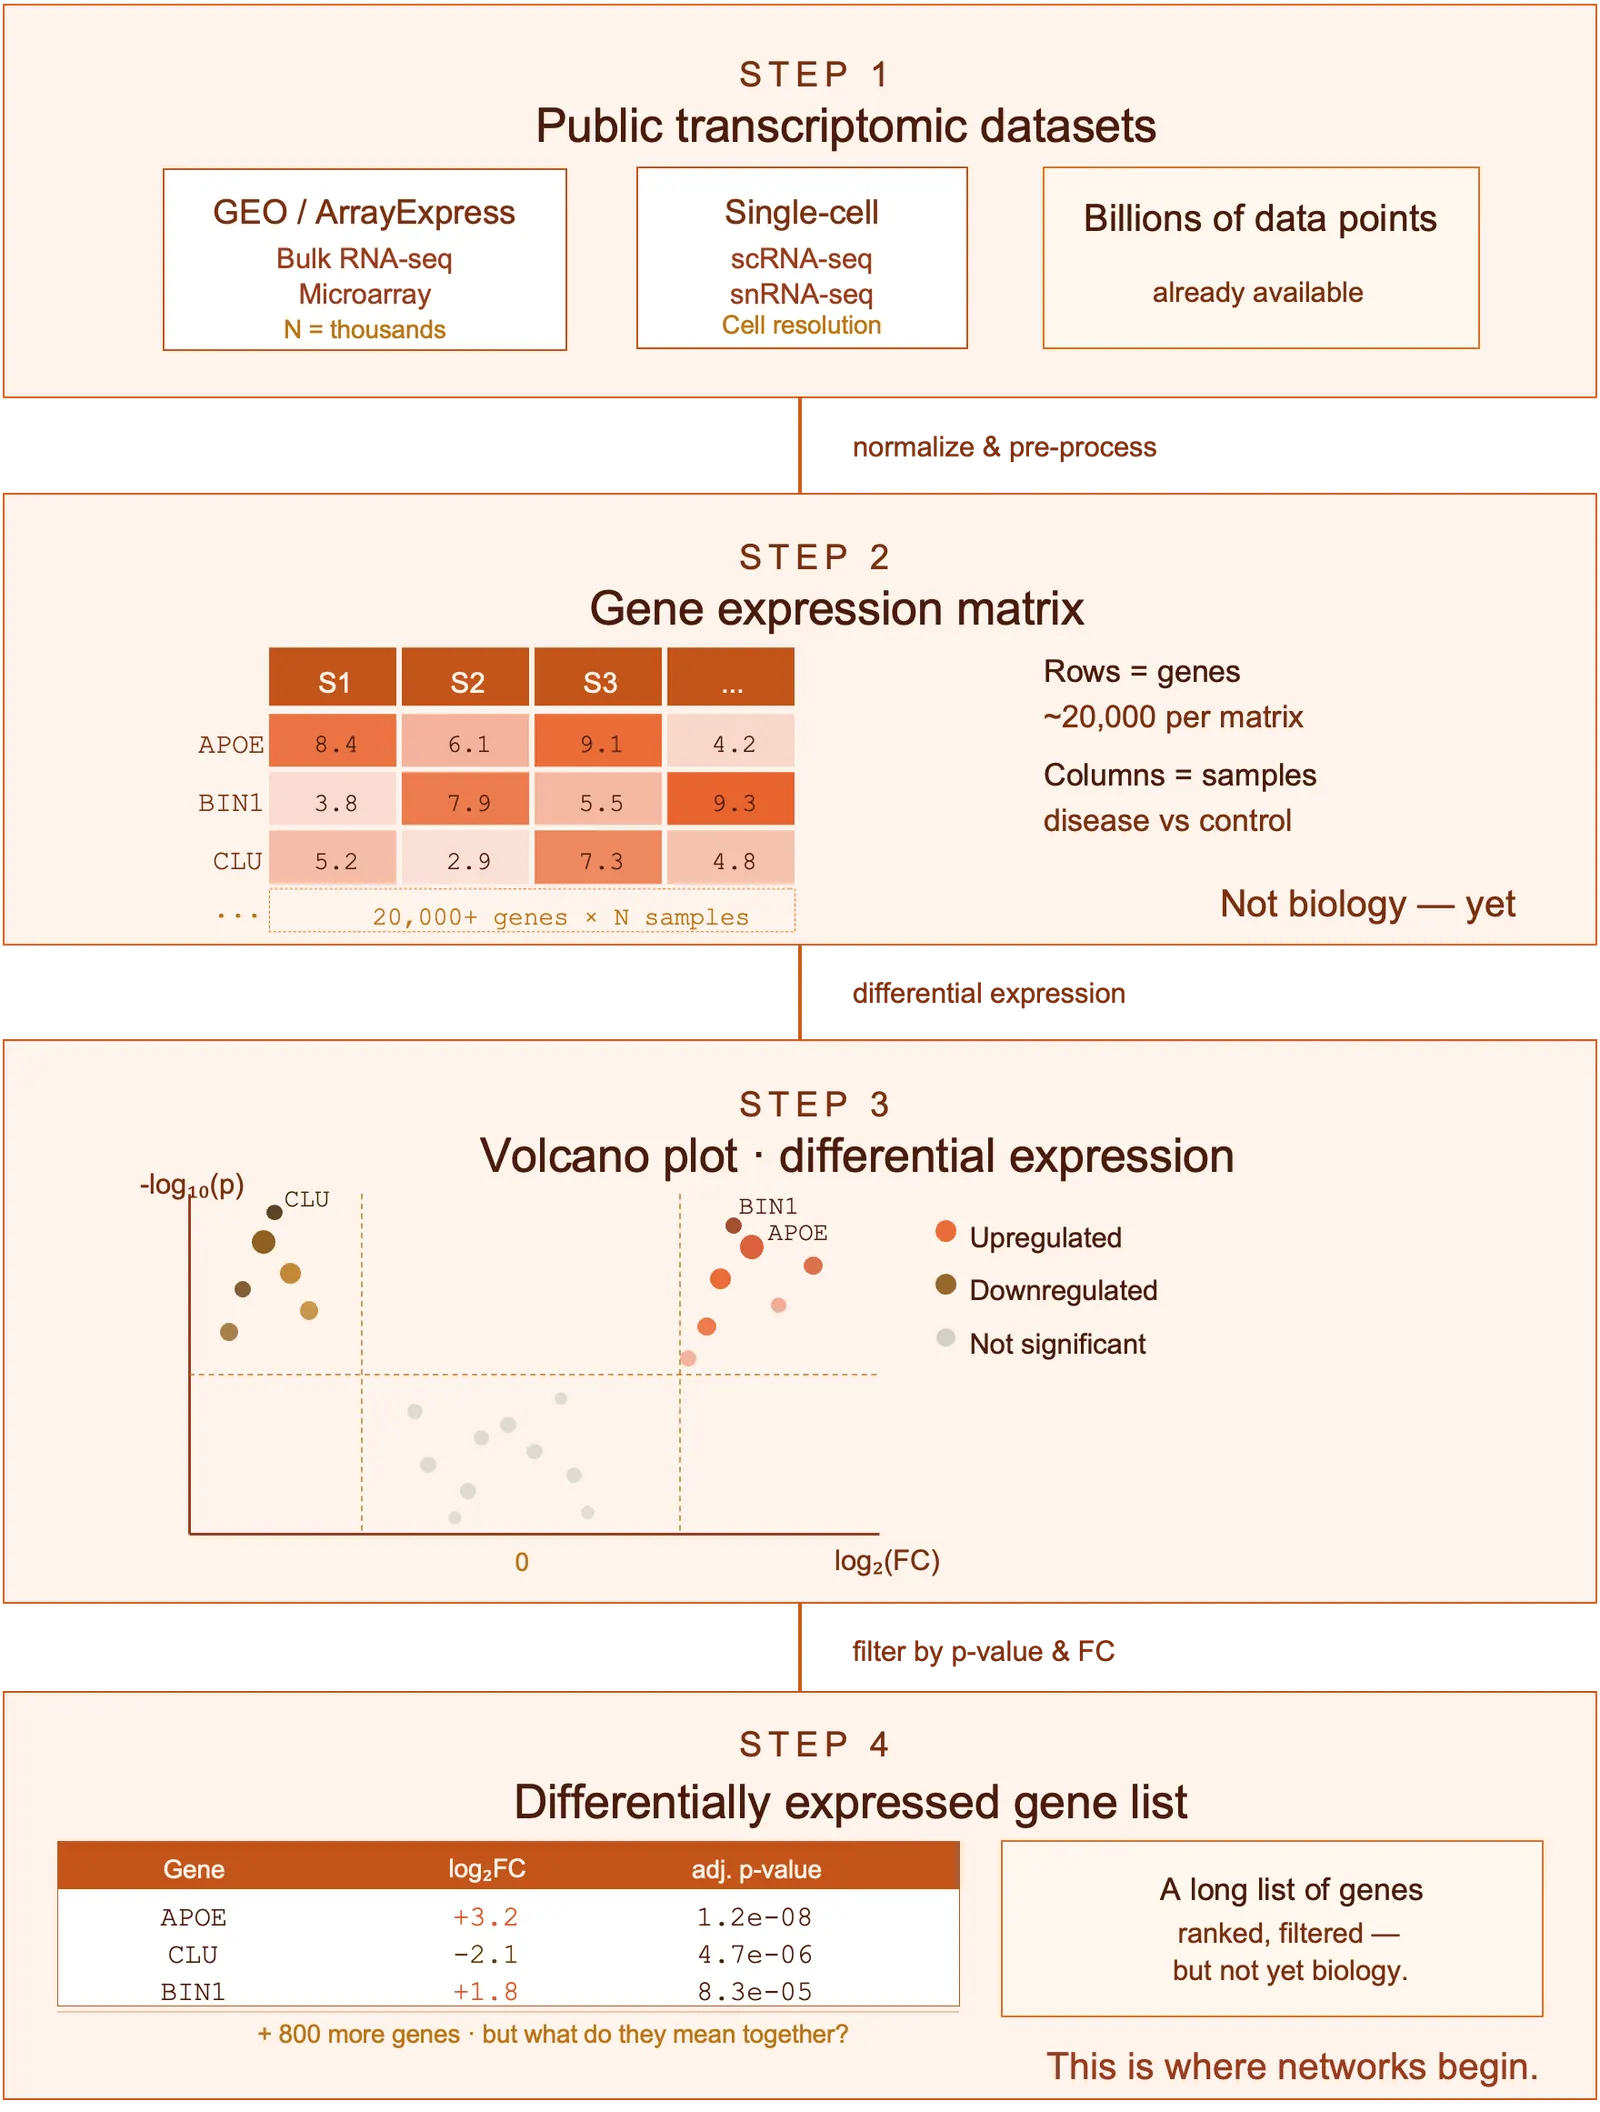
Public repositories
Thousands of datasets
Did you know that public repositories like GEO and ArrayExpress host tens of thousands of datasets, representing millions of samples and billions of data points?
We have entered an era where we are not lacking data. In fact, most of the biological questions researchers face today in their labs already have their answer in data that already exists. The challenge is no longer generating it. The challenge is: how do we actually use it?
A gene expression matrix is just numbers. It tells you what is expressed, which genes are up or downregulated, but it keeps you at the single-gene level. It does not tell you:
- How genes work together
- Which biological programs are active
- How disease mechanisms are organised as systems
That gap between measurement and meaning is exactly what systems biology, and particularly network biology, is built to fill.
From
Gene Expression Data to Biological Networks
So how do we extract biology from all transcriptomic data?
The answer starts with a simple but powerful observation. Genes that are involved in the same biological process tend to be expressed together. Not just in one experiment, not just in one tissue, but consistently, across independent studies, across different labs, different technologies, different sample compositions. That consistency is not noise, it is biology.
This is the principle behind co-expression networks. Instead of looking at one dataset at a time, we aggregate across many independent datasets and ask: which genes are reproducibly co-regulated?
We extract co-expression relationships across studies, and we keep the ones that hold up. The connections that survive this process are not just statistical correlations. They are edges that have been stress-tested against technical noise, batch effects, and biological confounders that are not reproducible across studies. What remains is a network of relationships that reflect something real about how genes are organized and regulated.
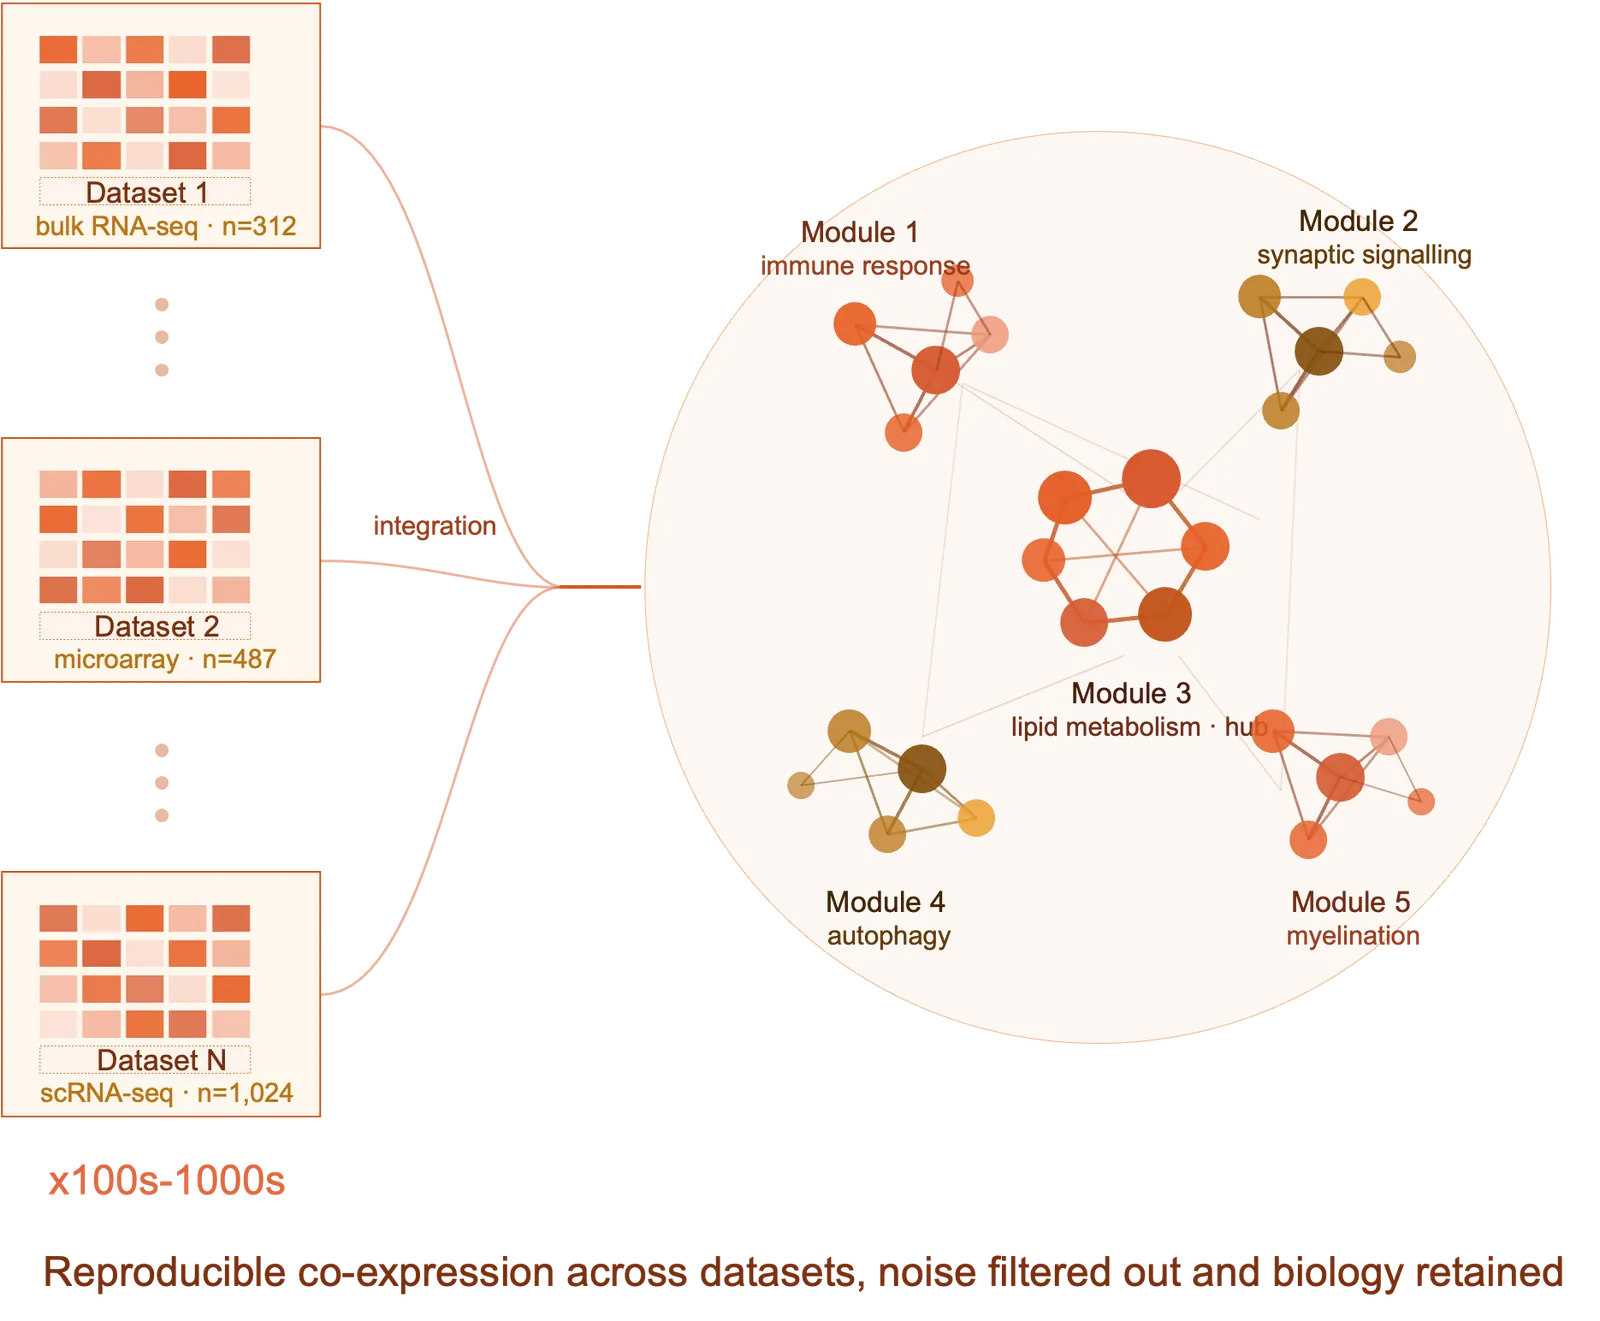
As shown in Oldham et al. (2008, Nature Neuroscience), co-expression structure in the human brain is remarkably reproducible across independent datasets, suggesting that the modules we recover reflect stable biological organization rather than dataset-specific variation.(1)
A co-expression relationship observed in a single dataset could be driven by sample composition, a confounding variable, or simply the technical characteristics of that particular experiment. But a relationship that holds across dozens of independent datasets, each with different samples, different conditions, different sources of noise, is a relationship that is grounded in biology.
The more datasets we include, the more signal we recover and the more noise we discard. The result is a network where every edge represents reproducible co-expression. Not just which genes correlate, but which genes are consistently co-regulated across biological contexts. And that distinction, between correlation and reproducible co-regulation, is what makes these networks interpretable as biology beyond statistics.
A co-expression network is a graph in which nodes represent genes and edges connect genes that are consistently co-expressed across samples. Unlike single-dataset correlations, robust co-expression networks are built by aggregating relationships across many independent studies, retaining only the connections that are reproducible across biological contexts.
The
Structure Is the Biology
Something that gets lost in single-gene analyses is that genes do not act in isolation.
What a gene does, what its activity actually means in a cell, is almost entirely determined by the context it operates in. For example: which other genes are active at the same time, which regulatory programs are running, which signals the cell is responding to. A gene that is upregulated in one context can be doing something completely different in another. Taken in isolation, it tells you very little. Placed within its network neighborhood, it starts to tell you a lot more.
This is what networks make visible. When genes are consistently co-expressed across independent datasets, it is not a coincidence. It reflects something about how those genes are wired together: shared transcription factor binding, shared regulatory elements, shared pathway membership, shared responses to the same upstream signals. The consistency of the co-expression relationship is evidence of an underlying biological connection.
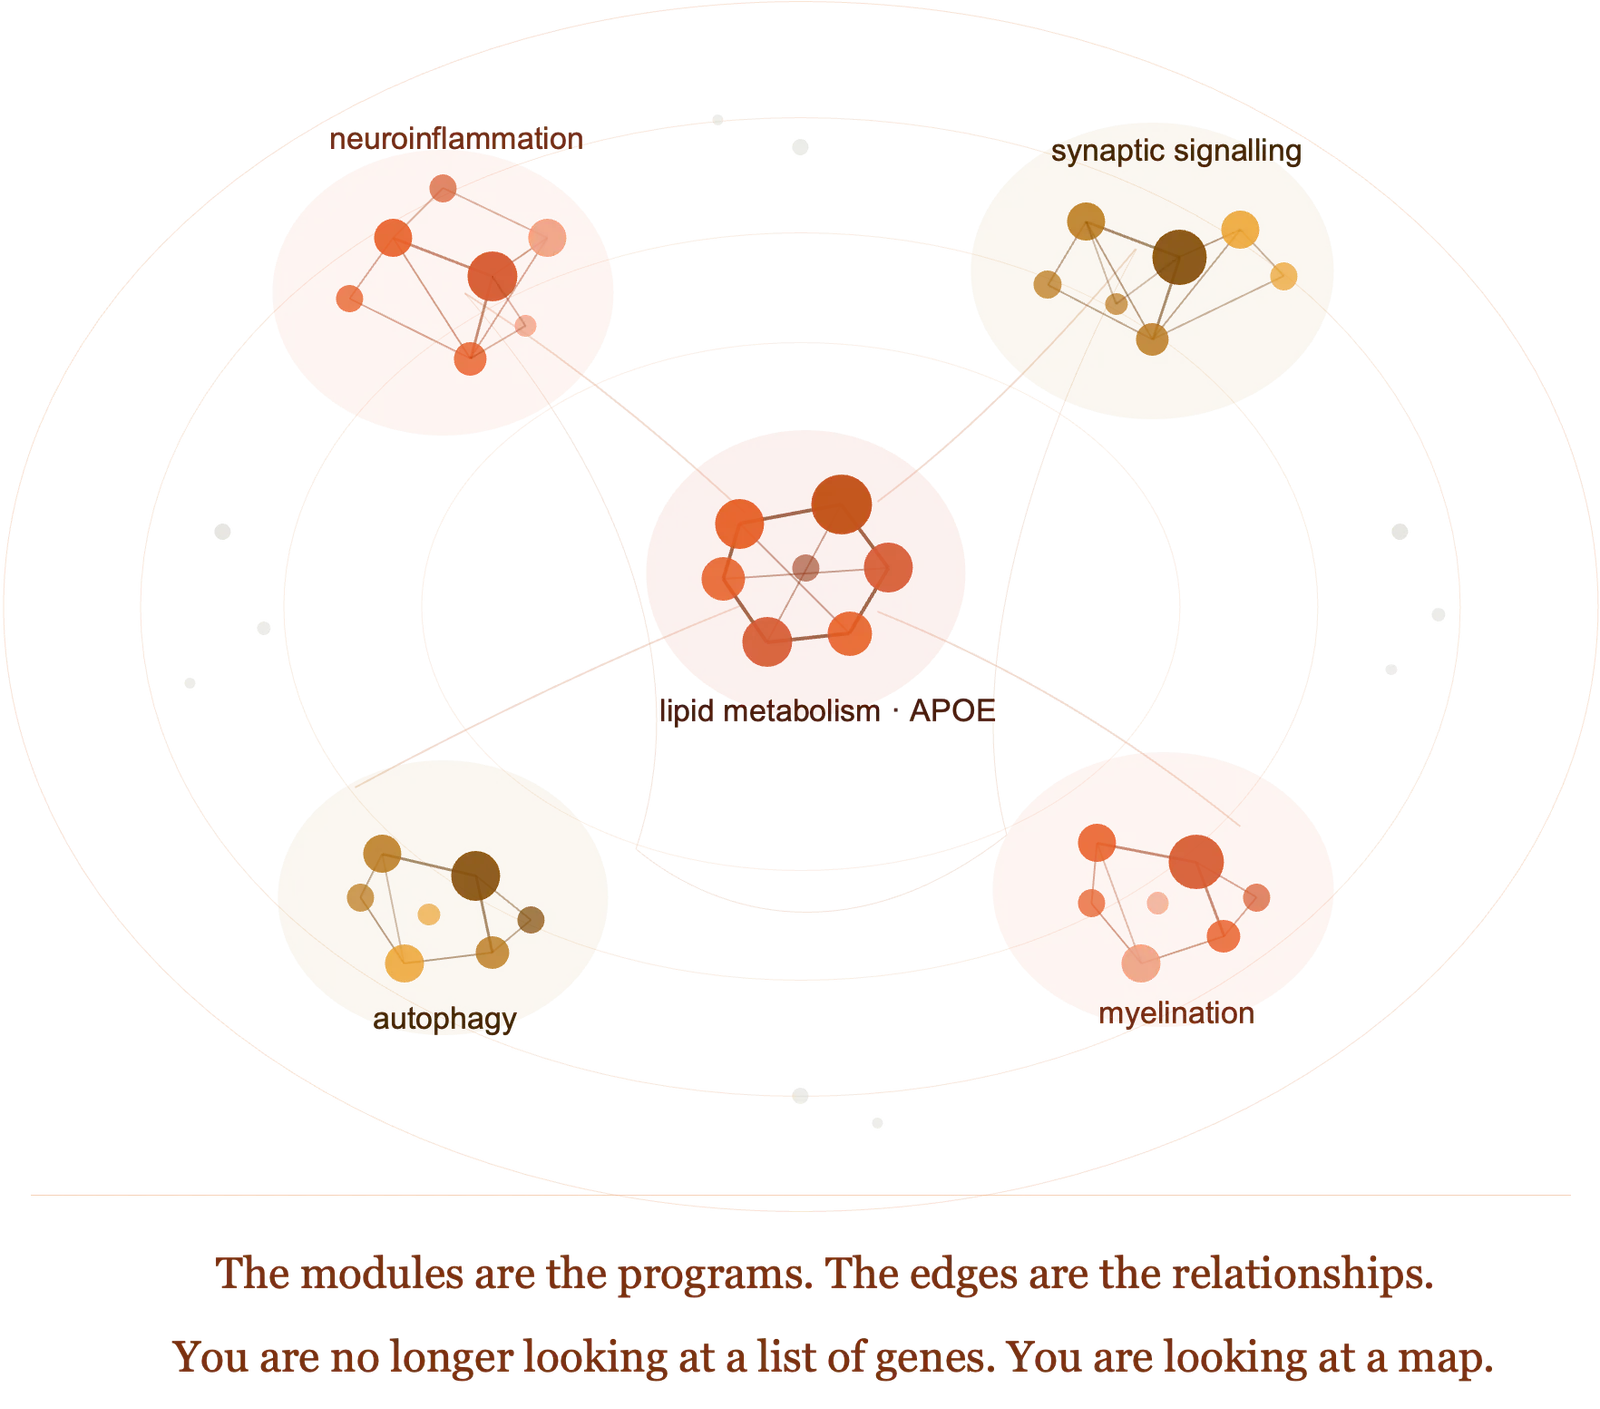
And when you look at the structure of a co-expression network, something immediately becomes clear. Genes do not distribute themselves randomly. They organize into modules. Groups of genes that are highly connected to each other, and more loosely connected to the rest of the network. These clusters are not a statistical artefact. They are biological modules or sets of genes that are co-regulated because they participate in the same cellular program. For instance, an inflammatory cascade, a lipid metabolism pathway, a stress response, and as shown in Barabási and Oltvai (2004, Nature Reviews Genetics), the modular organization of biological networks is a conserved property of living systems, from yeast to humans.(2)
The structure of the network is not a representation of the biology; it is the biology. The modules are the programs. The edges are the relationships. The topology tells you how the cell organises its activity into functional units. And once you can see that organisation, you are no longer looking at a list of genes. You are looking at a map.
From
Gene Lists to Gene Programs
Let me take you back to a familiar moment. You have run your differential expression analysis, applied your p-value cutoffs, and you are now looking at a list. Eight hundred genes, maybe more. Ranked, filtered, colour coded. A rigorous result. And yet most researchers feel the same thing at this point.
Where do I even begin?
The list is not wrong. But it treats every gene as an independent observation. It tells you what changed, but not whether those changes are coordinated, whether they reflect a coherent biological program, or whether half of them are noise that cleared a statistical threshold on this particular dataset.
This is exactly the question a network lets you answer.
When you place your differentially expressed genes onto a co-expression network, some of them are connected to each other. They form clusters. They are part of the same module, co-regulated with dozens of other genes, grounded in a program that has been defined across thousands of samples and independent datasets. Those genes are not just statistically significant. They are biologically coherent.
Other genes on your list sit alone. No connections, no module membership. And that isolation is itself information; whatever drove their differential expression did not leave a reproducible footprint in the biology. Those are your noise candidates.
What you are left with is not a ranked list, but a set of dysregulated programs, each with a structure, hub genes (highly connected nodes) at its centre, and a biological identity that emerges from its connections. You go from eight hundred names to three programs. And those three programs are interpretable in a way that a list never can be.
In Alzheimer’s Disease research, Zhang et al. (2013, Cell) showed that co-expression network analysis of late-onset Alzheimer's disease identified discrete gene modules associated with distinct biological processes, including immunity, myelination and synaptic function, several of which were not apparent from differential expression analysis alone.(3) Similarly, Mostafavi et al. (2018, Nature Neuroscience), produced a large-scale co-expression network analysis of the ROS/MAP cohort revealing that microglial and synaptic gene programs associate differentially with amyloid pathology and cognitive decline, pointing to network-level dysregulation as a key feature of disease progression.(4)
Biology is modular. Networks do not impose that structure, they reveal it. And once you can see the modules, you are no longer asking what changed. You are asking how the system reorganised itself. That is a different kind of insight entirely.
References
- Oldham, M. C., Konopka, G., Iwamoto, K., Langfelder, P., Kato, T., Horvath, S., & Geschwind, D. H. Functional organization of the transcriptome in human brain. Nature neuroscience, 11(11), 1271–1282 (2008). doi:10.1038/nn.2207 (opens in a new tab)
- Barabási, A. L., & Oltvai, Z. N. Network biology: understanding the cell's functional organization. Nature reviews. Genetics, 5(2), 101–113. (2004). doi:10.1038/nrg1272 (opens in a new tab)
- Zhang, B., Gaiteri, C., Bodea, L. G., Wang, Z., McElwee, J., Podtelezhnikov, A. A., Zhang, C., Xie, T., Tran, L., Dobrin, R., Fluder, E., Clurman, B., Melquist, S., Narayanan, M., Suver, C., Shah, H., Mahajan, M., Gillis, T., Mysore, J., MacDonald, M. E., … Emilsson, V. Integrated systems approach identifies genetic nodes and networks in late-onset Alzheimer's disease. Cell, 153(3), 707–720. (2013). doi:10.1016/j.cell.2013.03.030 (opens in a new tab)
- Mostafavi, S., Gaiteri, C., Sullivan, S. E., White, C. C., Tasaki, S., Xu, J., Taga, M., Klein, H. U., Patrick, E., Komashko, V., McCabe, C., Smith, R., Bradshaw, E. M., Root, D. E., Regev, A., Yu, L., Chibnik, L. B., Schneider, J. A., Young-Pearse, T. L., Bennett, D. A., … De Jager, P. L. A molecular network of the aging human brain provides insights into the pathology and cognitive decline of Alzheimer's disease. Nature neuroscience, 21(6), 811–819. (2018). doi:10.1038/s41593-018-0154-9 (opens in a new tab)
About the author

Camila Guerrero De Blois, PhD
Scientific Affairs Lead, Computational Biology
Camila holds a PhD in Translational Research in Hematology-Oncology and trained in multiple myeloma clinical and translational research. Her expertise spans computational biology, bioinformatics, multi-omics data analysis, and oncology clinical research.